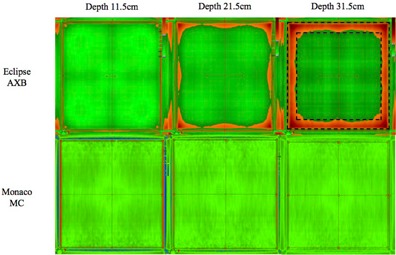
Figure 6.

2D absolute gamma comparisons between TPS‐computed and IC‐measured dose planes for field size . Areas that passed gamma criterion are indicated in green and areas of failure are indicated in red. The outer dashed box and the inner dashed box mark the 100% and 80% field areas included for analysis, respectively.
