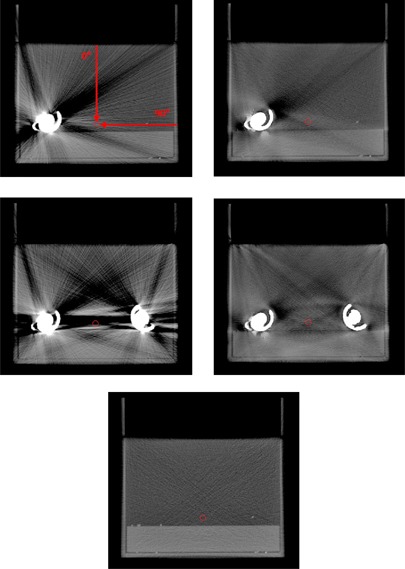
Figure 3.

Uncorrected (left) and O‐MAR corrected (right) CT images of the phantom with one hip prosthesis (top) and two hip prostheses (middle). The reference image without any metal present is shown at the bottom. The position of the point of interest, to which the WETs are calculated, is marked by a circle. WET values were calculated from the edge of the phantom to the point of interest at every forth degree from 0° to 360° (0° and 90° are marked in the top left image).
