
Figure 4.
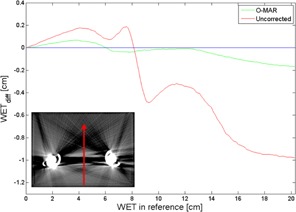
WET differences, along the line marked in the inserted image, for the O‐MAR corrected image and the uncorrected image as functions of the WET at the corresponding position in the reference image. The use of the O‐MAR algorithm led to a substantial decrease of the metal artifact‐induced WET difference. The line of zero WET difference is provided to guide the eye.