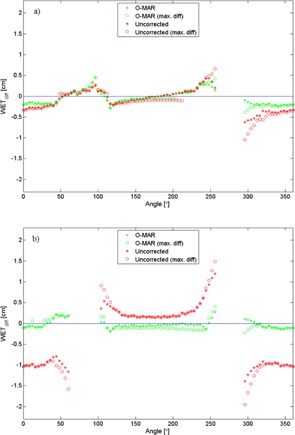
Figure 5.

Differences in WET between the reference images and the uncorrected and O‐MAR corrected images, respectively, for the phantom with one prosthesis (a) and two prostheses (b). The WET values are calculated from the edge of the phantom to a point of interest between the prostheses. The WET data corresponding to beam angles intersecting the prostheses are excluded. The lines of zero WET difference are provided to guide the eye.
