
Figure 3.
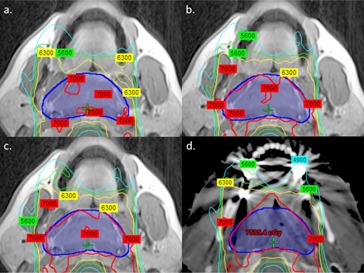
Comparison of isodose distributions between (a) ‐based, (b) ‐based, (c) ‐based, and (d) CT‐based inverse‐optimized IMRT plans for Patient 3. Images were obtained at the identical axial level based on CT‐MRI registration. Isodose distributions were calculated on CT with heterogeneity correction to standardize comparisons.