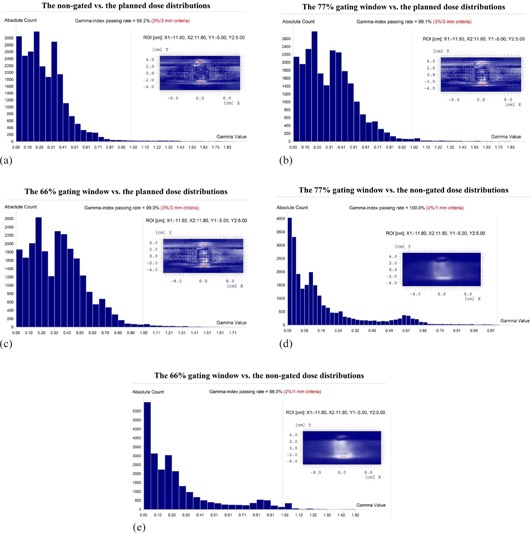
Figure 3.

Gamma index analyses of Patient 1's coronal dose distributions: (a)–(c) the measurements of the non‐gated, 77% and 66% gating windows deliveries vs. the planned, respectively (3%/3 mm criteria); (d)–(e) the gated 77% and 66% gating windows vs. the non‐gated deliveries, respectively (2%/1 mm criteria). The horizontal axis is the gamma value. The red vertical line indicates where the gamma value is equal to 1. The vertical axis is the absolute count of the number of the pixels in the corresponding gamma range. The insets show the difference in the dose/DTA of the compared dose distributions in the selected ROI. The blue, white, and red color scales represent that the gamma value , , and , respectively. These data were collected with the CVDR and the default accelerator GHT of 1.38 s.
