Figure 5.

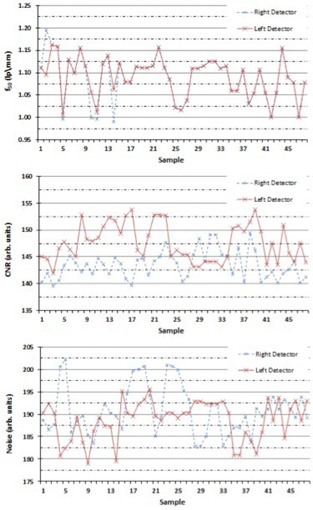
The run chart for the values (top), the CNR values (middle), and the noise values (bottom) determined by using the QCkV‐1 phantom and the PIPSpro software, for both the left and right detectors.

The run chart for the values (top), the CNR values (middle), and the noise values (bottom) determined by using the QCkV‐1 phantom and the PIPSpro software, for both the left and right detectors.