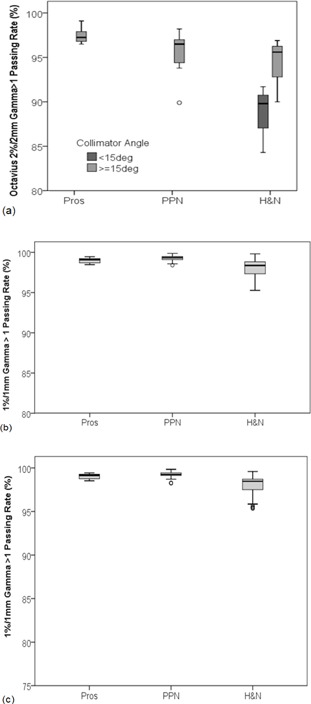
Figure 1.

Box plots of gamma passing rates for pretreatment verification using (a) OCTAVIUS (2%/2 mm), (b) pretreatment trajectory log files (1%/1 mm), and (c) on‐treatment verification using trajectory log files (1%/1 mm). Results are stratified per treatment site ‐ prostate (Pros), prostate and pelvic node (PPN), and head and neck (H&N). Boxes represent median and interquartile range (IQR). Whiskers represent the spread of the data. Outliers are denoted by open circles. The effect of collimator angles on OCTAVIUS gamma passing rates is noted for H&N cases in Fig. 1 (a).
