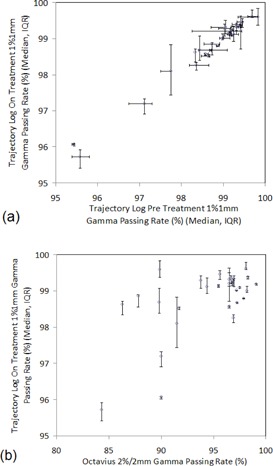
Figure 2.

Correlation between 2D trajectory log files on‐treatment fluence delivery accuracy and (a) 2D trajectory log files pretreatment fluence delivery accuracy and (b) 3D OCTAVIUS pretreatment dose delivery accuracy. Circles represent median values and error bars represent the interquartile range (IQR).
