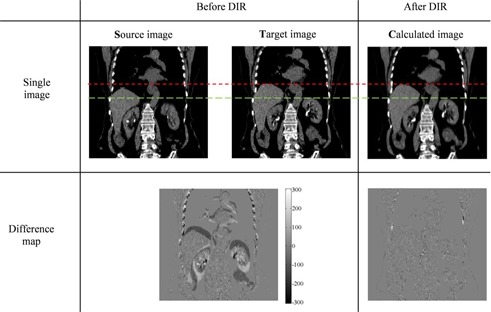
Figure 1.

Example of deformable image registration (DIR) using the optical flow method shown in the coronal view (for Patient 1). The upper (red, short dash) and lower (green, long dash) lines show the alignment of the top of the liver and the kidneys respectively, before and after DIR to aid visual comparison of the images. A difference map before performing DIR illustrates the difference between the source and target images; the post‐DIR difference map compares the target and calculated images. The scale in the difference map is in HU.
