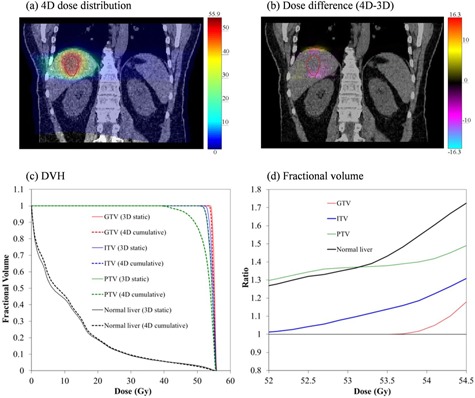
Figure 4.

Illustration of 4D evaluation of 3D plan: (a) 4D calculated dose distribution for Lesion D (coronal plane shown); (b) dose difference between 3D and 4D in the same plane; all units of dose are gray; (c) dose‐volume histograms for targets and normal liver: solid and dashed lines illustrate 3D and 4D dose calculations, respectively; (d) the ratio of 3D‐calculated fractional volume relative to the 4D calculation over the to range derived from the histogram (red = GTV, blue = ITV, green = PTV, and black = normal liver).
