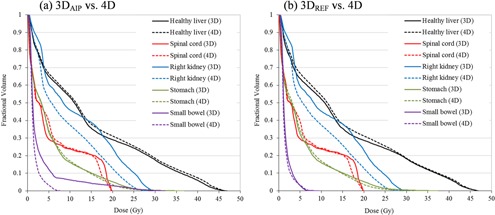
Figure 6.

An example of dose‐volume histogram (DVHs) comparisons for critical organs in Patient 1: (a) vs. 4D, (b) vs. 4D. Solid and dashed lines illustrate the results calculated from 3D static and 4D cumulative dose calculation, respectively (black = normal liver, red = spinal cord, blue = right kidney, green = stomach, and purple = small bowel).
