
Figure 3.
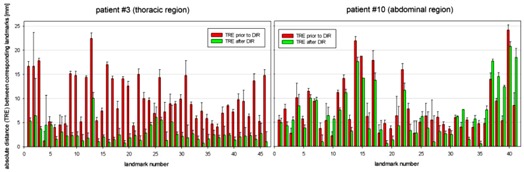
3D distances of landmarks between the planning CT and the respective fraction CT for the two patients with best and worse achieved registration quality; distances prior to the DIR (red bars) and the target registration error (green bars) after applying the DIR. The error bars indicate the interobserver uncertainty for each landmark.