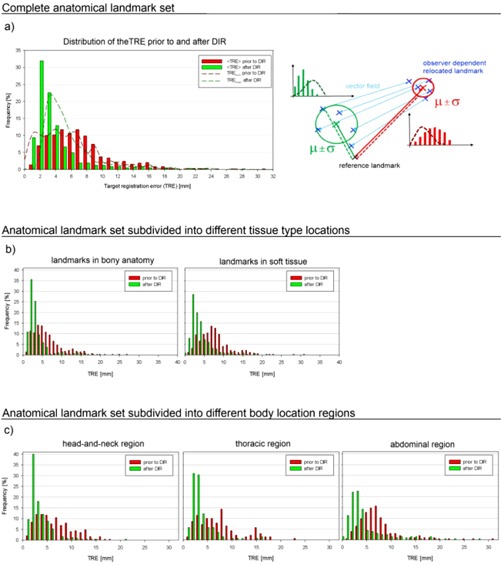
Figure 4.

The bars represent the distribution of the distances prior to (red) and after (green) registration. (a) TRE distribution for all landmarks. The better the registration quality, the narrower and more shifted towards zero the distribution should be. The dashed lines indicate the uncertainty based on interobserver variations. The sketch on the right visualizes the values sampled in these distributions. The continuous red (green) lines are considered for the distribution plotted using bars and the dashed lines indicate distances sampled for the dashed distributions; μ indicates the mean landmark position and σ is the standard deviation between the five positions of the different observers. (b) Same illustration when landmarks are subdivided in two groups depending on their tissue surroundings, in bony anatomy (left) or in soft tissue (right). (c) Subdivision of all landmarks into three groups depending on the investigated tumor location: head and neck (left), thoracic (center), and abdominal regions (right).
