
Figure 1.
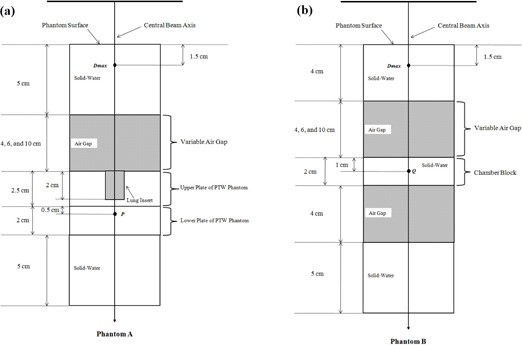
Schematic diagram of the experimental setup for the central axis depth dose computations and measurements in inhomogeneous phantoms: (a) Phantom A and (b) Phantom B The central axis percent depth doses (PDDs) at P and Q were calculated by normalizing the dose at P or Q to the dose at Dmax.