Figure 10.

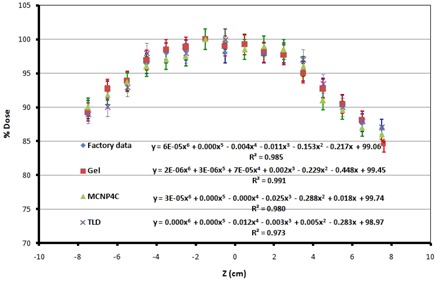
Dose profile along z‐axis, comparison of different methods (factory data, PAGAT gel dosimetry, Monte Carlo simulation, and TLD).

Dose profile along z‐axis, comparison of different methods (factory data, PAGAT gel dosimetry, Monte Carlo simulation, and TLD).