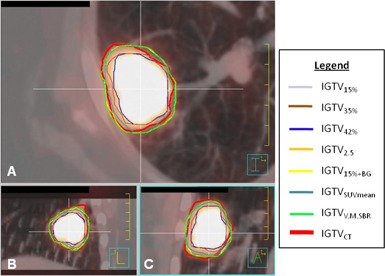
Figure 4.

PET/CT images of tumor 13 with internal target volume (ITV) contours: (a) transverse, (b) sagittal, and (c) coronal. , shown in red, was delineated on the maximum intensity projection. Other ITVs were delineated on PET using methods described in Table 1. The VMSBR model () is shown in green.
