Figure 3.

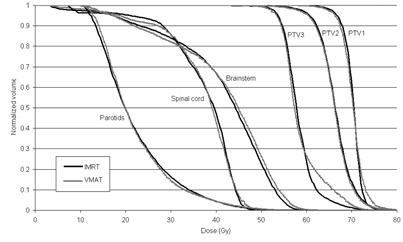
Averaged dose‐volume histogram over all ten nasopharynx patients, comparing the VMAT and IMRT automatically generated solutions.

Averaged dose‐volume histogram over all ten nasopharynx patients, comparing the VMAT and IMRT automatically generated solutions.