Figure 5.

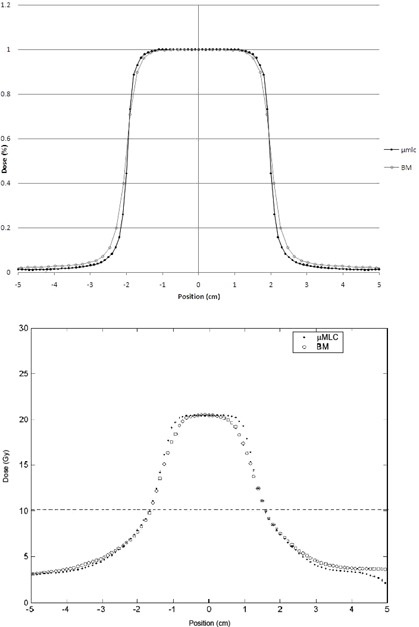
Comparison of measured profiles for (a) a and a BM 6 MV, field. Comparison of profiles extracted from a TPS map for (b) a plan and a BM plan. The horizontal line marks the half maximum dose.

Comparison of measured profiles for (a) a and a BM 6 MV, field. Comparison of profiles extracted from a TPS map for (b) a plan and a BM plan. The horizontal line marks the half maximum dose.