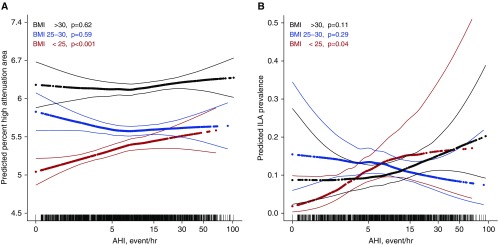
Figure 1.
Continuous associations of the obstructive apnea hypopnea index with (A) high-attenuation areas and (B) interstitial lung abnormalities stratified by body mass index (BMI) category. HAA models are adjusted for age, sex, race/ethnicity, smoking status and pack-years, educational attainment, height, glomerular filtration rate, percent emphysema on CT, milliampere dose, total imaged lung volume, and study site. ILA models are adjusted for age, sex, race/ethnicity, smoking status, and pack-years. The thick lines represent the overall adjusted effect estimate; thin lines indicate the 95% confidence bands. Each vertical mark in the rug plot along the x-axis represents one study participant. P values are from generalized additive models and differ somewhat from the P values in Table E2, which are from generalized linear models. AHI = apnea–hypopnea index; CT = computed tomography; HAA = high-attenuation area; ILA = interstitial lung abnormality.

