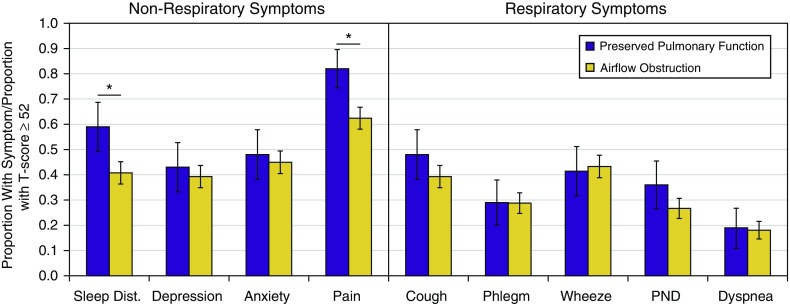
Figure 1.
Symptoms reported among participants with preserved pulmonary function and with airflow obstruction. Shown is the proportion of participants in each group with respiratory and nonrespiratory symptoms of interest. For symptoms measured continuously by T-score, the cutoff is made at a score of 52 (general population mean plus the minimum important difference of 2). Error bars refer to 95% confidence intervals. Proportions compared by χ2 test; *P < 0.05. Dist. = disturbance; PND = paroxysmal nocturnal dyspnea.

