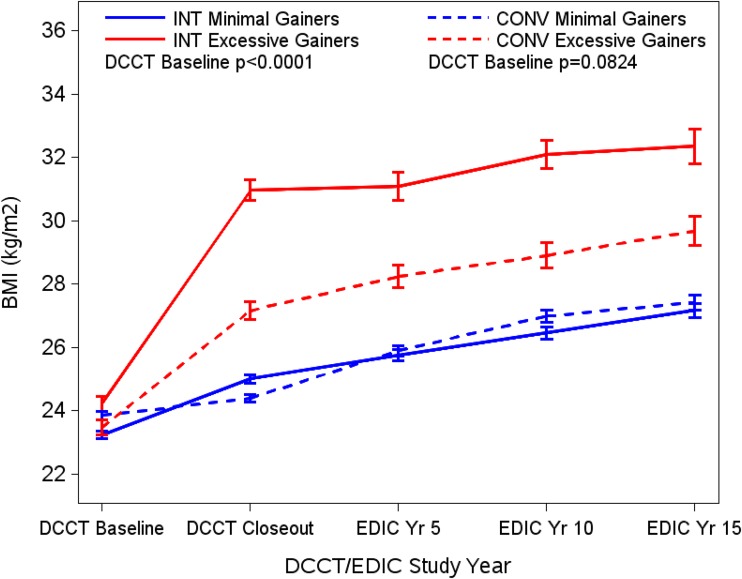
Figure 1.
BMI of participants at the DCCT baseline, DCCT closeout, and EDIC years 5, 10, and 15 by quartile of weight gain between the DCCT baseline and closeout (excessive = fourth quartile of weight gain [red lines]; minimal = first through third quartiles combined [blue lines]) in both the INT and CONV groups. Data are mean ± SE.

