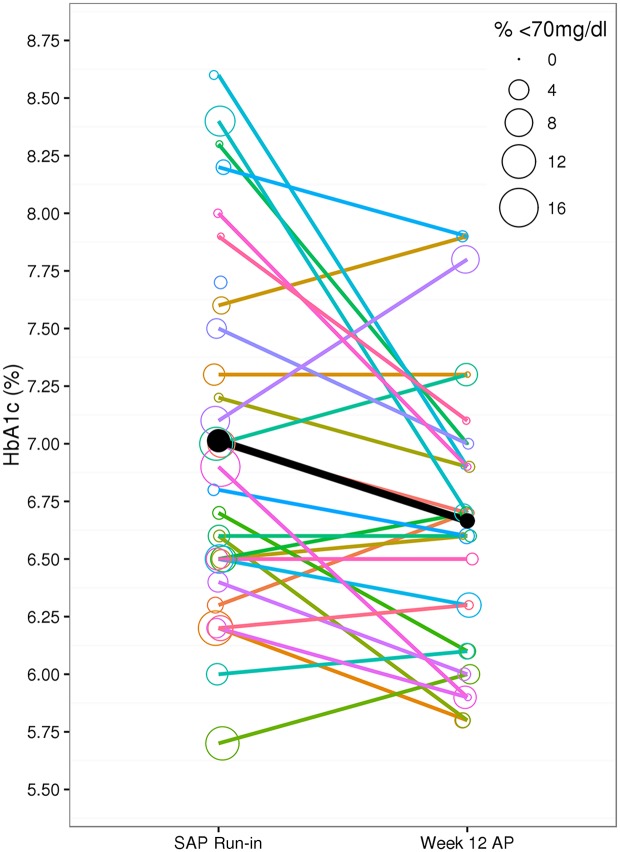
Figure 2.
Change in HbA1c compared with percentage of time in hypoglycemia. Represented are the individual HbA1c measurements and the percentage of time CGM glucose was <70 mg/dL (radius of the circle) experienced by each patient, comparing the SAP run-in week to the final week of AP use. The mean HbA1c change and reduction in the percentage of time in CGM glucose of <70 mg/dL is shown by the black line and filled in black circles. Changes for individual subjects are shown by the colored lines and colored circles.

