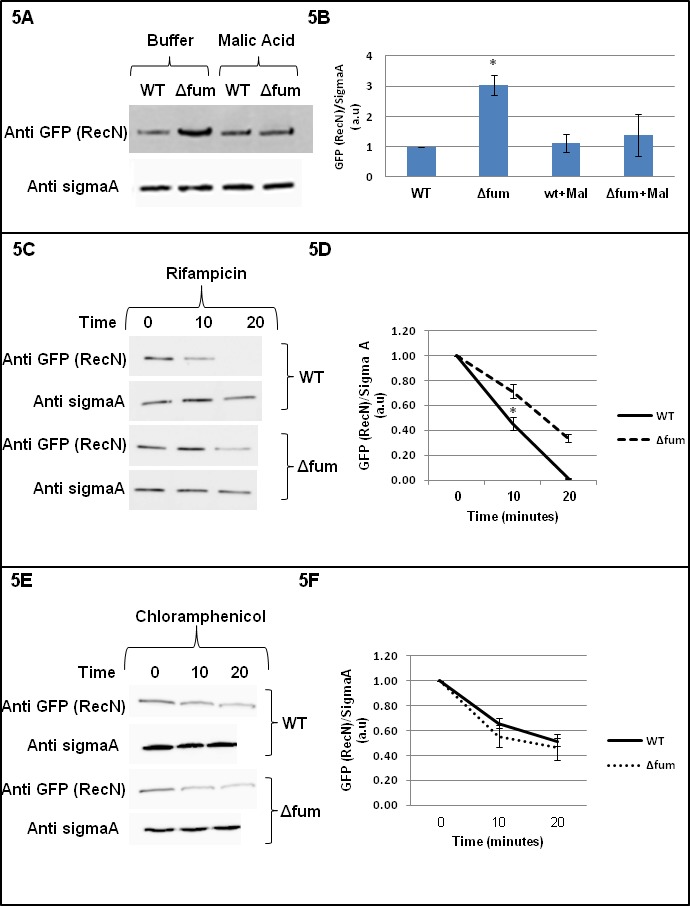
Figure 5. Fumarase affects RecN levels.

(A) RecN level is increased upon DNA damage. Wild type and Δfum strains, expressing RecN-GFP, were grown to logarithmic phase and MMS was added to final concentration of 0.07% (v.v). The cells were plated onto LB plates containing 250 mM of phosphate buffer (pH = 6.8) and L-malic acid, 10 mM. Cells were collected from the plates and the levels of RecN were determined in extracts by western blot analysis. Anti-SigmaA was used as a loading control. (B) RecN level is increased upon DNA damage. The chart presents the relative amount of RecN in the absence or presence of MMS with or without MMS (densitometric analysis of Figure 4C normalized to SigmaA, mean ±SEM [n = 3], p=0.05). (C) Wild type and Δfum cells containing RecN-GFP were grown exponentially in LB and exposed to 0.07% (v/v) MMS for 30 min at 37°C. Rifampicin (100 μg/ml) was added to inhibit transcription (time 0). The fate of RecN was followed by western blot and densitometric analysis (normalized to SigmaA and shown as optical density arbitrary units). (D) The chart presents the relative amount of RecN after treatment with Rifampicin (densitometric analysis of Figure 4E normalized to SigmaA). The RecN concentration at time 0 was arbitrarily determined as 100% and the results represent a mean ±SEM (n = 3), p=0.04. (E) Wild type and Δfum cells containing RecN-GFP were grown exponentially in LB and exposed to 0.07% (v/v) MMS for 30 min at 37°C. Chloramphenicol (Cm, 20 μg/ml) was added to inhibit protein synthesis (at time 0). At the times indicated cell growth was halted by addition of NaN3 (10 μM), and the fate of RecN was followed by western blot analysis. (F) The chart presents the relative amount of RecN after treatment with chloramphenicol (densitometric analysis of Figure 5E normalized to SigmaA). The RecN concentration at time 0 was arbitrarily determined as 100% and the results represent a mean ±SEM (n = 3).
