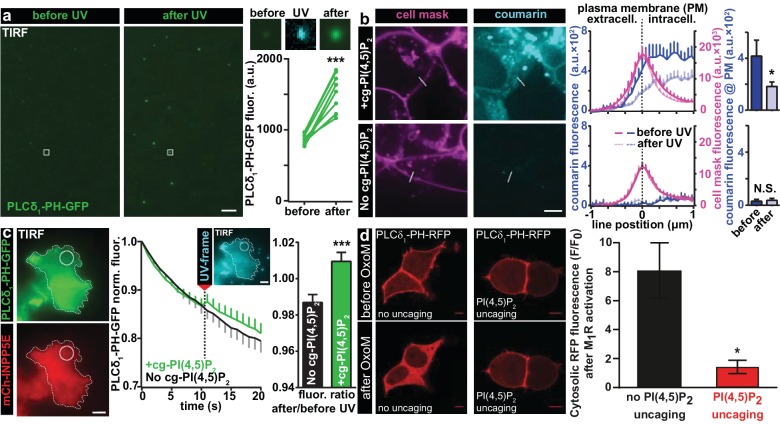
Figure 2. Characterization of PI(4,5)P2 UV uncaging in-vitro, loading of cg-PI(4,5)P2 into living cells and visualization of PI(4,5)P2 uncaging in several cell types.
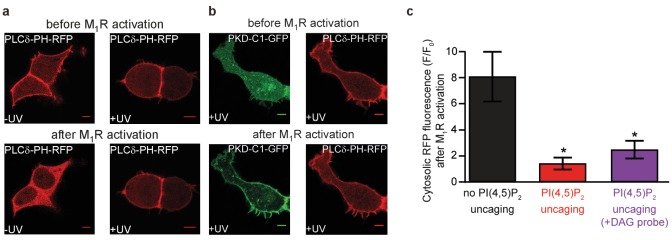
(a) Uncaging of cg-PI(4,5)P2 micelles on a glass coverslip results in the relocation of a high affinity PI(4,5)P2 sensor, PLCδ1-PH-EGFP, to micelles following UV light exposure, as seen by a local increase in 488 nm excited fluorescence using TIRF microscopy. The two images on the left show the EGFP fluorescence before and after UV uncaging (note the background fluorescence due to soluble PLCδ1-PH-EGFP). The region within the white square is one example of an analyzed micelle. Magnified views are shown on the right before (EGFP fluorescence), during (showing coumarin/cg-PI(4,5)P2-fluorescence) and after (EGFP fluorescence) UV (405 nm) light in the TIRF field. The quantification shows the analysis of the fluorescence of all 10 micelles seen in this image frame. (b) HEK cells were either loaded for 30 min at 37°C with 20 µM of cg-PI(4,5)P2 (+cg-PI(4,5)P2, top line), or not loaded (No cg-PI(4,5)P2, bottom line). All cells were treated with the vehicle DMSO (0.2%), Pluronic (0.02%), CellMask Deep Red plasma membrane stain and imaged on a spinning disc confocal microscope. Fluorescence line profiles were collected to investigate cellular uptake of cg-PI(4,5)P2. Profiles were aligned to the local intensity maxima of the CellMask fluorescence indicating the position of the plasma membrane and revealed intracellular coumarin/cg-PI(4,5)P2 (compare dark blue profiles with and without cg-PI(4,5)P2). After cells were exposed to UV (405 nm) illuminations, the intensity distribution of the coumarin fluorescence was altered (light blue profiles) and intensity at the position of the plasma membrane significantly reduced (bar graph in top line), indicating PI(4,5)P2 uncaging. (c) COS-7 cells expressing PLCδ1-PH-EGFP (top left panel) and a plasma membrane targeted, m-Cherry tagged inositol polyphosphate 5-phosphatase (mCh-INPP5E) (bottom left panel) were either loaded for 30 min at 37°C with 20 µM cg-PI(4,5)P2 (+cg-PI(4,5)P2) or not loaded (No cg-PI(4,5)P2) and imaged on a TIRF microscope. All cells were treated with the vehicle DMSO (0.2%) and Pluronic (0.02%). Center panel: average EGFP fluorescence of ROIs at the plasma membrane (example shown in the images on the left) imaged at 1 Hz in the TIRF field in both groups (+cg-PI(4,5)P2: green, No cg-PI(4,5)P2: black). Between the 10th and the 11th frame, UV-uncaging was performed. The image acquired during the UV-frame (showing coumarin/cg-PI(4,5)P2-fluorescence) is shown as an insert. Right panel: the fluorescence change following uncaging was calculated by dividing the per-ROI fluorescence values in the 11th frame by those in the 10th frame. In cells loaded with cg-PI(4,5)P2, PLCδ1-PH-EGFP fluorescence increased in the TIRF field after UV-uncaging. (d) tsA-201 cells overexpressing M1 muscarinic receptors and PLCδ1-PH-RFP were imaged on a laser scanning confocal microscope. Due to the high affinity of the probe, endogenous PI(4,5)P2 levels are already sufficient to localize the probe to the plasma membrane at the beginning of the experiment (top line). Application of 1 µM of the M1 receptor agonist oxotremorine-M (Oxo-M) resulted in the translocation of the sensor to the cell center indicative of plasmalemmal PI(4,5)P2 breakdown in cells loaded with cg-PI(4,5)P2, but not subjected to UV-uncaging (no uncaging, bottom left image, black bar graph). This response was nearly abolished in cells subjected to UV light (PI(4,5)P2 uncaging, bottom right image and red bar graph). F/F0 signifies the ratio of fluorescence values within the cytosol at the end of the experiment (F) (21–22 s after the uncaging and 20 s after the application of oxotremorine-M) by the fluorescence at the beginning of the experiment (F0). See Figure 2—figure supplement 1 for further details. Scale bars 5 µm. All values are mean ±SEM. *p<0.05; **p<0.01; ***p<0.001. In panels a and b, paired t-tests were used, in panels c and d, unpaired two-tailed t-tests were performed. Number of cells (n): panel b: n = 14 cells (+cg-PI(4,5)P2), n = 5 cells (No cg-PI(4,5)P2). Panel c: n = 15 cells (+cg-PI(4,5)P2), n = 15 cells (No cg-PI(4,5)P2). Panel d: n = 6 cells (no uncaging), n = 12 cells (PI(4,5)P2 uncaging).


