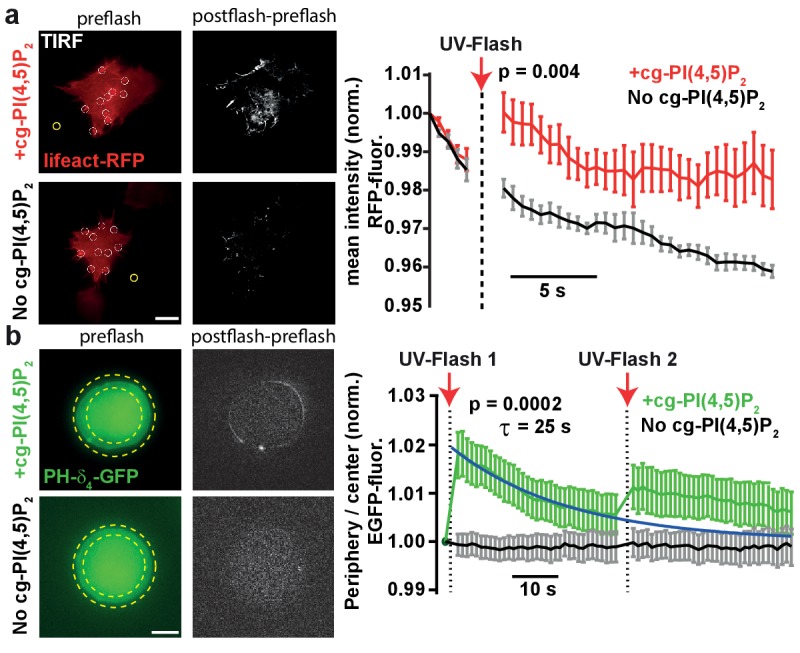
Figure 3. PI(4,5)P2 uncaging increases actin levels near the plasma membrane and recruits the low affinity PI(4,5)P2 sensor PLCδ4-PH-EGFP to plasma membranes of adrenal chromaffin cells.

(a) TIRF imaging of HEK cell footprints transfected with lifeact-RFP to label actin. Cells were either loaded for 30 min at 37°C with 20 µM cg-PI(4,5)P2 (+cg-PI(4,5)P2, top) or not loaded (No cg-PI(4,5)P2, bottom). All cells were treated with the vehicle DMSO (0.2%) and Pluronic (0.02%). Five baseline images were acquired at 2 Hz in the RFP channel, before a 405 nm UV laser was used to uncage PI(4,5)P2 in the TIRF field. Imaging in the RFP channel was then resumed at 2 Hz. The second column depicts difference images of the frames immediately after and before UV exposure (only fluorescence increase is shown). To quantify fluorescence, regions of interests (ROIs) were placed on fluorescence-rich regions that appeared to be actin bundles (white circles in the left images). A background subtraction was performed in each frame (yellow ROI). Fluorescence values were averaged per cell, normalized to the values of the first frame and then averaged across cells. The right panel depicts the average normalized fluorescence per frame in both groups (+cg-PI(4,5)P2: red, No cg-PI(4,5)P2: black). The RFP fluorescence in the TIRF field increased in cells loaded with cg-PI(4,5)P2 after uncaging. (b) To verify PI(4,5)P2 uncaging in chromaffin cells, the low-affinity PI(4,5)P2-sensor PLCδ4-PH-EGFP was expressed and cells were imaged on a bright-field fluorescence microscope. Cells were either loaded for 30–45 min at 37°C with 25 µM cg-PI(4,5)P2 (+cg-PI(4,5)P2, top) or not loaded (No cg-PI(4,5)P2, bottom). After a single EGPF frame, a strong UV-flash was applied. Imaging was then resumed in the EGFP channel at 1 Hz. The second column depicts difference images of the frames immediately after and before UV-flash exposure (only fluorescence increase is shown). To quantify translocation of the PLCδ4-PH-EGFP probe, the ratio of EGFP fluorescence in the periphery (between the two yellow dotted circles) and the center of the cell (inner yellow dotted circle) was measured and normalized to pre-flash values. The right panel shows the frame-wise quantification of the average (cell wise) ratio in both groups (+cg-PI(4,5)P2: green, No cg-PI(4,5)P2: black). The fluorescence ratio increased in cells loaded with cg-PI(4,5)P2 after UV-uncaging, indicating release of PI(4,5)P2 in the plasma membrane. The fluorescence ratio relaxed to baseline with a mono-exponential time course (blue line). A second UV-flash applied 38.5 s after the first one also increased the ratio, but to a lesser degree. Scale bars 5 µm. All values are mean ±SEM. Mann-Whitney U-tests were used to calculate p-values. Number of cells (n): panel a: n = 6 cells (+cg-PI(4,5)P2), n = 5 cells (No cg-PI(4,5)P2). Panel b: n = 15 cells (+cg-PI(4,5)P2), n = 20 cells (No cg-PI(4,5)P2).
