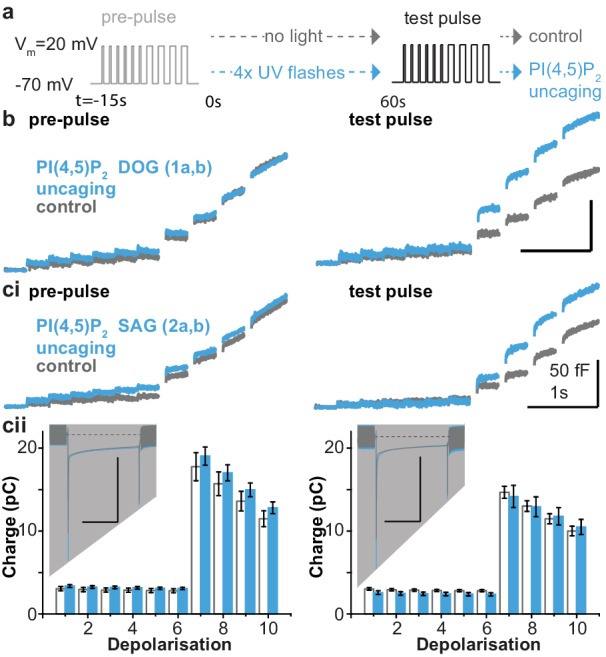
Figure 4. PI(4,5)P2 uncaging potentiates exocytosis in adrenal chromaffin cells, which depends on the lipid head group but does not alter depolarization-induced currents.
(a) Physiological stimulation paradigm to investigate the effect of PI(4,5)P2 uncaging on exocytosis. Cells were loaded with compounds 1a,b or 2a,b prior to experiments. After a pre-pulse of depolarizing voltage steps, cells were either subjected to UV uncaging (PI(4,5)P2 uncaging group) or not (control group). The effect of PI(4,5)P2 uncaging was investigated in a subsequent test pulse. The pre-pulse and the test pulse consisted of six brief (10 ms) and four longer (100 ms) depolarizations to allow Ca2+ influx and induce exocytosis (Voets et al., 1999). (b,ci) Whole-cell membrane capacitance measurements during the pre- and the test pulse were performed to quantify exocytosis (average traces are shown). (b) Uncaging a PI(4,5)P2 variant featuring a non-natural short-chain fatty acid composition (1a,b in Figure 1a) increased exocytosis during the test pulse. (ci) Uncaging of PI(4,5)P2 with the natural fatty acid composition (SAG, compound 2a,b, Figure 1a,b) had similar effects. (cii) Depolarization-induced cumulative currents (charges, Q, which mostly originate from Ca2+-currents) were similar between both groups for all 10 depolarization steps of pre- and test pulse. Insert: average currents during the first 100 ms depolarization, dashed line indicates baseline. Scale bar in the insert: 0.5 nA and 50 ms. See Figure 4—figure supplement 2 for corresponding analysis of compound 1a,b. Number of cells (n): n = 27 (wild type control, loaded with 1a,b), n = 26 (wild type PI(4,5)P2 uncaging, loaded with 1a,b); n = 23 (wild type control, loaded with 2a,b), n = 23 (wild type PI(4,5)P2 uncaging, loaded with 2a,b).

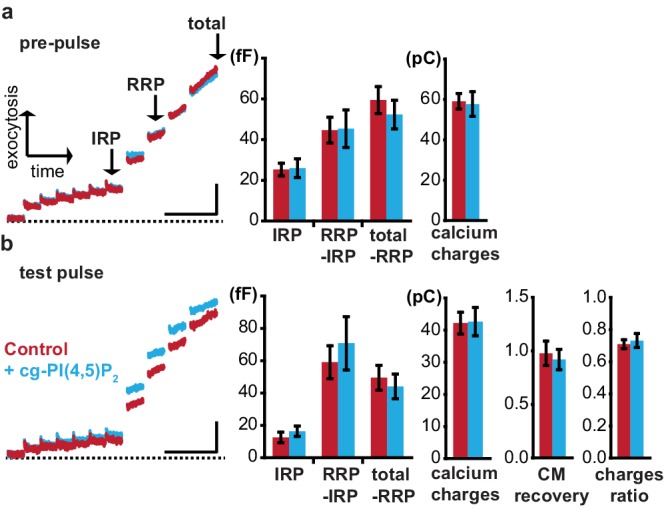
Figure 4—figure supplement 1. Incubation with cg-PI(4,5)P2 does not affect exocytosis.

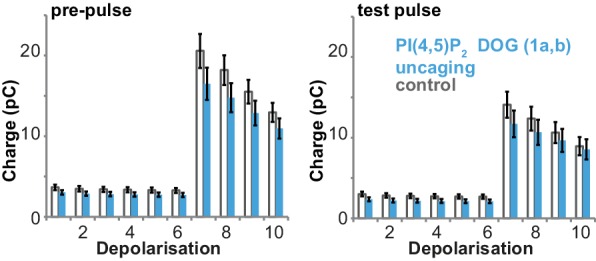
Figure 4—figure supplement 2. Uncaging of PI(4,5)P2 DOG (compound 1a,b in Figure 1a) does not alter depolarization-induced currents.


