
Figure 5. Uncaging of PI(4,5)P2, but not DAG augments exocytosis.
(a) Left panel: mean whole-cell capacitance responses during the test pulse of chromaffin cells loaded with cg-PI(4,5)P2 (data from compounds 1a,b and 2a,b pooled, uncaging group: blue, control group: grey). Different secretion phases are indicated. Right panel: cell-wise quantification. IRP = Immediately Releasable Pool; RRP = Readily Releasable Pool, slope = slope determined by linear fit of sliding capacitance. (b) Structure of caged DAG (cg-DAG). (c) Titration to determine the intracellular cg-PI(4,5)P2 concentration by comparison of coumarin fluorescence in cells loaded with known cg-DAG concentrations via the patch pipette, yielding [cg-PI(4,5)P2]=29 µM. (d) Left panel: depolarization-induced capacitance (average trace) elicited by the test pulse (same stimulation as in Figure 4a) in cells exposed to DAG uncaging (green), or not (grey, control). No augmentation was seen. Middle and right panel: quantification of IRP, RRP, total secretion and slope revealed no significant changes. Scale bars 20 fF/1 s. Statistical testing by unpaired Student’s t-test; **p<0.01; ***p<0.001. Number of cells (n): panel a: n = 50 (wild type control), n = 49 (wild type PI(4,5)P2 uncaging); panel c: n = 16 (cg-DAG 5 µM), n = 3 (cg-DAG 15 µM), n = 6 (cg-DAG 30 µM), n = 4 (cg-DAG 45 µM), n = 5 (cg-DAG 100 µM), n = 14 (cg-PI(4,5)P2), panel d: we used two different cg-DAG concentrations (cg-DAG, 45 µM = 6 cells and cg-DAG, 30 µM = 15 cells); pooled results are shown; n = 20 (wild type control), n = 21 (wild type DAG-uncaging).
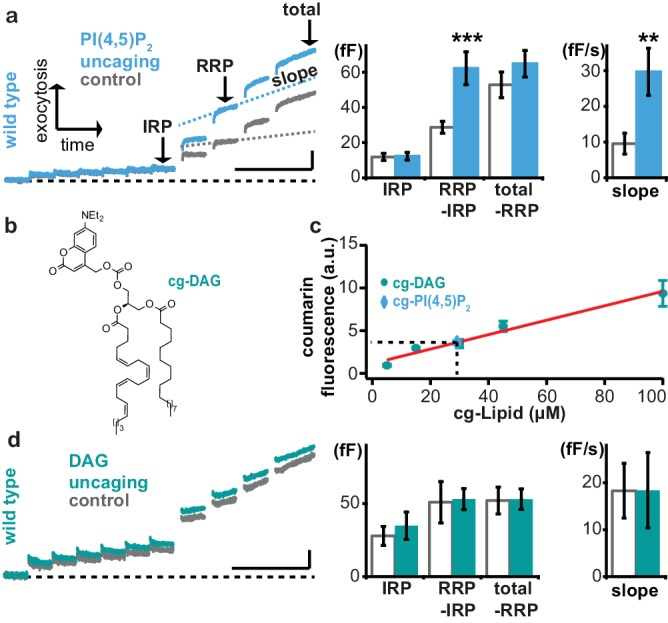
Figure 5—figure supplement 1. Blocking PI(4,5)P2-degradation to DAG augments recovery of the RRP.
