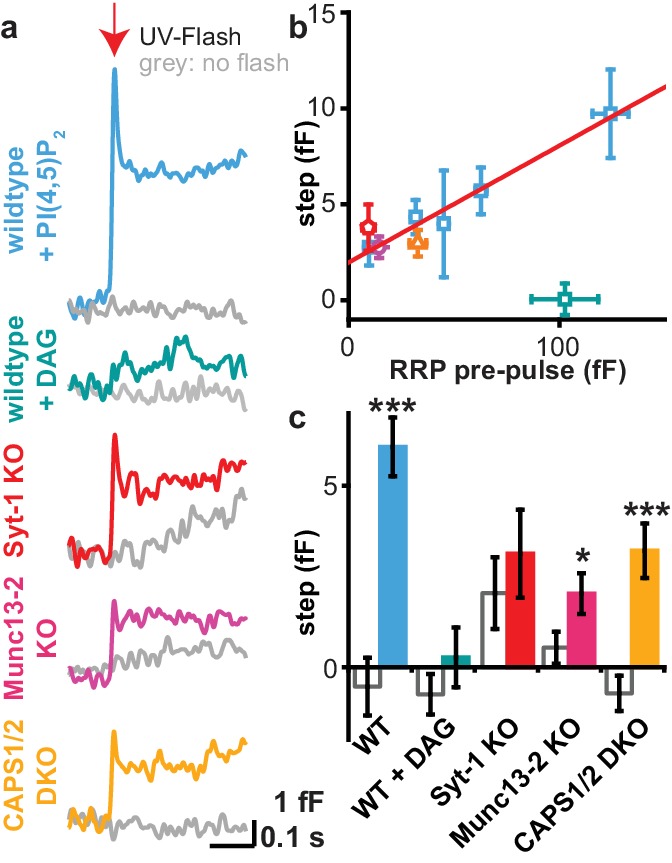
Figure 7. Uncaging PI(4,5)P2 induces rapid exocytosis.
(a) PI(4,5)P2 uncaging rapidly increased membrane capacitance measured during the first uncaging flash (stimulation protocol: see Figure 4a), indicative of fast vesicle fusion. Averaged capacitance traces during the first uncaging flash are shown for wild type (WT, light blue), Syt-1 KO (red), Munc13-2 KO (magenta) and CAPS1/−2 DKO (yellow) and together with their respective controls (no UV light, grey). Note that the uncaging event follows the first depolarization train, and in the syt-1 KO there is still some ongoing, delayed secretion, as indicated by the upward ‘sloping’ control trace. (b) In wild type cells, the size of the capacitance step was highly correlated to the size of the readily releasable pool (RRP; assayed during the pre-pulse – see Figure 4a). Data are median values ± SEM of cells sorted by their RRP size and binned. The correlation (corr. R²-value: 0.97) indicates that the capacitance step is likely caused by rapid fusion of RRP vesicles. (c) Quantification of traces depicted in (a). Shown is the average capacitance increase (from the first to the last value shown in (a)) in control (no UV light, grey) and uncaging groups. Statistical testing by unpaired Student’s t-test; *p<0.05; **p<0.01; ***p<0.001. Number of cells (n): n = 50 (wild type, control, data of the compounds 1a,b and 2a,b were pooled), n = 49 (wild type, PI(4,5)P2 uncaging, data of the compounds 1a,b and 2a,b were pooled), n = 21 (CAPS1/−2 DKO control), n = 20 (CAPS1/−2 DKO PI(4,5)P2 uncaging), n = 32 (Munc13-2 KO control), n = 37 (Munc13-2 KO PI(4,5)P2 uncaging), n = 33 (Syt-1 KO control), n = 36 (syt-1 KO PI(4,5)P2 uncaging).

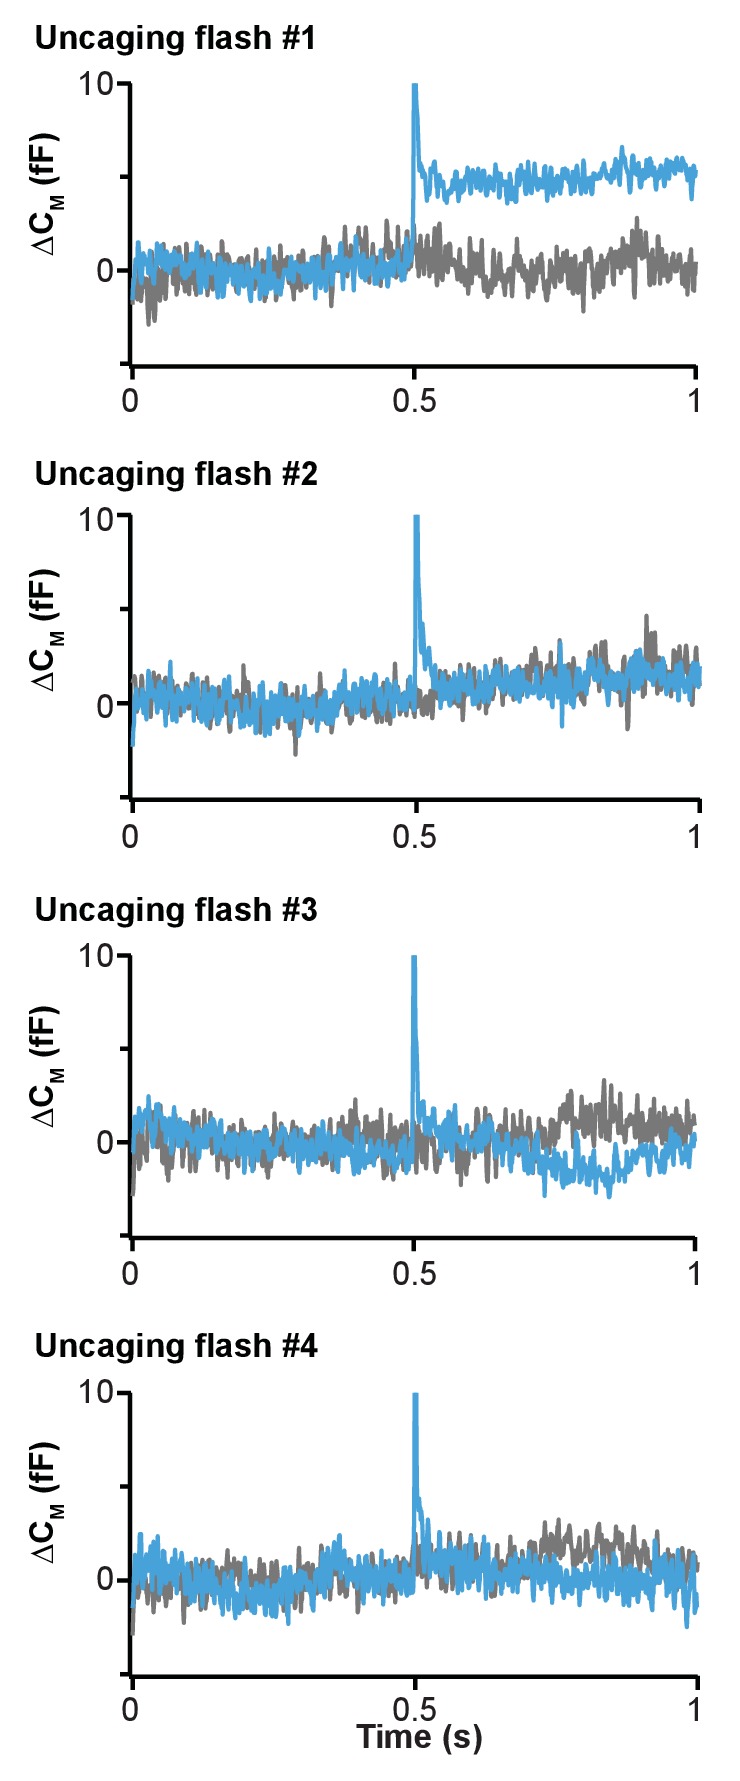
Figure 7—figure supplement 1. Fast release of vesicles upon first PI(4,5)P2 uncaging event in wild type chromaffin cells.

