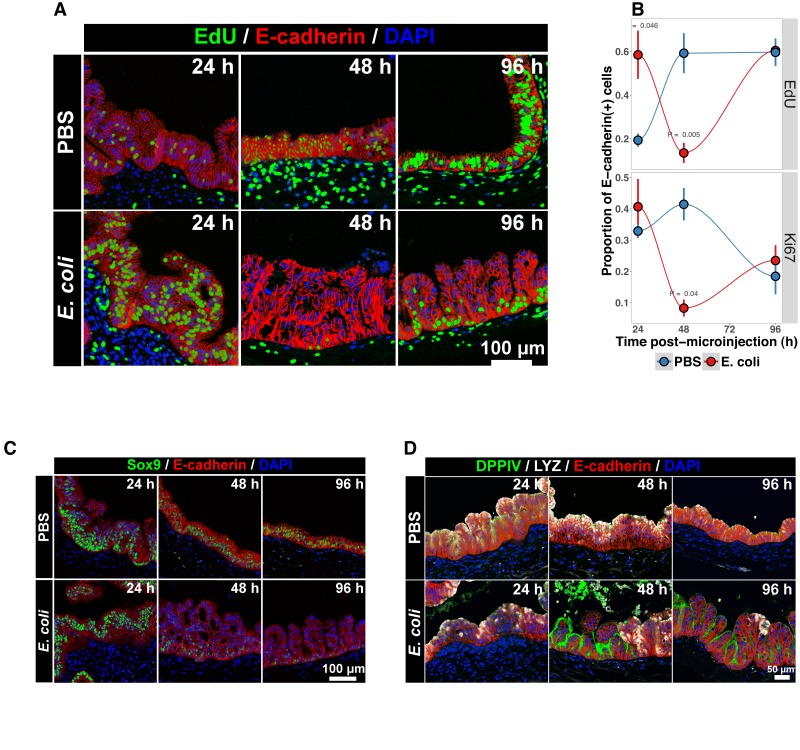
Figure 3. Bacterial colonization results in a transient increase in epithelial proliferation and the maturation of enterocytes.
(A) Representative confocal micrographs of HIOs injected with PBS or 104 CFU E. coli str. ECOR2 at 24–96 hr post-microinjection and stained with fluorescent indicators for for EdUDNA, E-cadherin, or nuclei (DAPI) as indicated in the figure labels . All HIOs were exposed to 10 M EdU at 22 hr post-microinjection and EdU was removed at 24 hr. Panels are representative of 4 HIOs per timepoint per treatment condition. (B) Quantification of the number of EdU-positive and Ki67-positive epithelial cells (E-cadherin cells) per 10X confocal microscopy field. One 10X confocal microscopy field consisting of 200–1000 epithelial cells was collected from each of 4 HIOs per timepoint per treatment group. The error bars represent the standard error of the mean and the p-values reflect the results of an unpaired two-tailed Student’s t-test comparing the PBS-injected HIOs to the E. coli-injected HIOs at that timepoint. (C) Representative confocal micrographs of HIOs injected with PBS or 104 CFU E. coli str. ECOR2 at 24–96 hr post-microinjection and stained with fluorescent antibodies for Sox9, E-cadherin, or nuclei (DAPI) as indicated in the figure labels. Panels are representative of 4 HIOs per timepoint per treatment condition.


