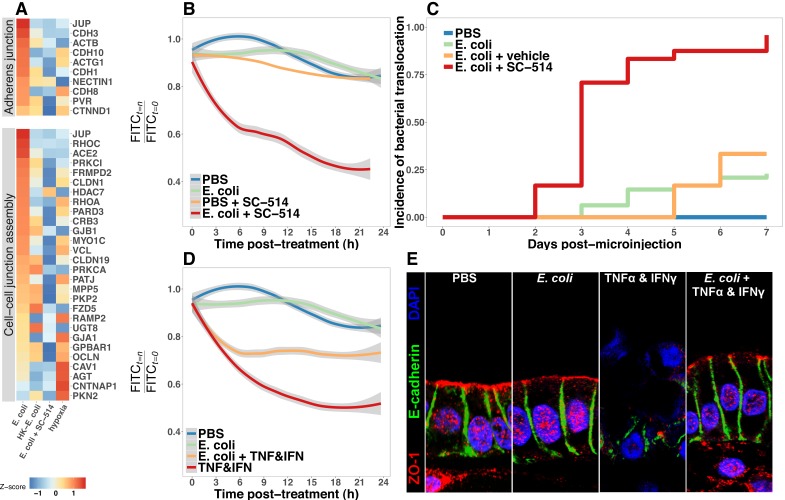
Figure 8. Bacterial colonization promotes resilience of the epithelial barrier via NF-κB.
(A) Heatmap of RNA-seq data indicating the relative expression of genes associated with the Adherens junction or Cell-cell junction assembly based on annotation in the REACTOME database. Results represent the mean of N = 4–5 biological replicates per treatment condition, with each replicate consisting of 5–6 pooled and identically treated HIOs. (B) Relative fluoresscence intensity over time in HIOs microinjected with 4 kDa FITC-dextran and imaged at 10 min intervals. HIOs were pretreated by microinjection with 104 CFU E. coli in PBS or PBS alone and cultured for 24 hr prior to treatment with media containing 10 M SC-514 or PBS alone and the injection of 2 mg/ml FITC-dextran (4 kDa) at the start of imaging. Line represents the best fit to the mean fluorescent intensity values in each condition with the grey region indicating S.E. for the fit line. N = 7–9 HIOs per group. (C) Rate of bacterial translocation over time in HIOs treated as indicated in the figure legend as detected by daily collection of external HIO media and enrichment in bacterial growth broth. N = 24 (E. coli + SC-514), N = 48 (E. coli), and N = 12 (PBS and E. coli + vehicle). (D) Relative fluorescence intensity over time in HIOs microinjected with FITC-dextran and imaged at 10 min intervals. HIOs were pretreated by microinjection with 104 CFU E. coli in PBS or PBS alone and cultured for 24 hr prior to treatment with media containing 500 ng/ml TNF-α and 500 ng/ml IFN-γ or PBS alone and the injection of 2 mg/ml FITC-dextran (4 kDa) at the start of imaging. Line represents the best fit to the mean fluorescent intensity values in each condition with the grey region indicating S.E. for the fit line. N = 8–9 HIOs per group. (E) Representative confocal micrographs of HIOs treated as indicated in D. Fluorescent immunostaining pseudocoloring applied as indicated in the figure legend. 60X optical magnification with 2X digital zoom. SC-514, small molecule inhibitor of NF-κB ; HK, heat-inactivated; TNF, tumor necrosis factor-α; IFN, interferon-γ.


