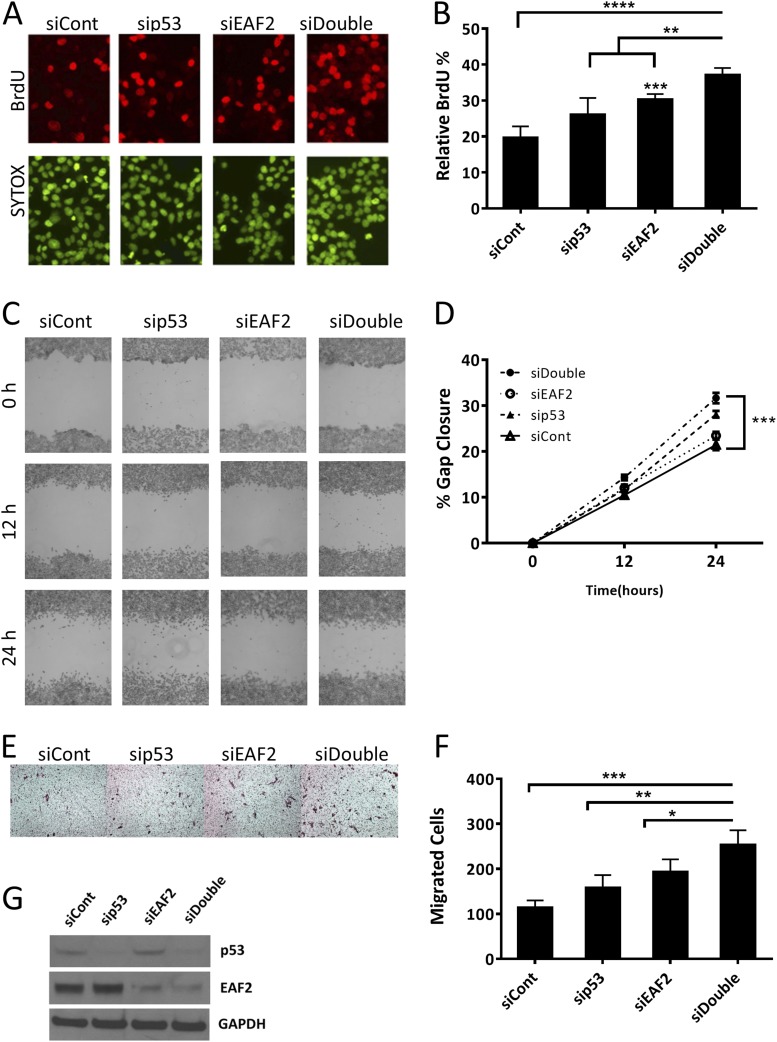
Figure 2.
Cell proliferation and migration in EAF2- and p53-deficient C4-2 cells. (A) BrdU incorporation in C4-2 cells transfected with nontargeted control (siCont) siRNA, targeted to p53 (sip53), EAF2 (siEAF2), or concurrent EAF2 and p53 (siDouble) knockdown. The upper panel shows BrdU-positive nuclei (red), and the lower panel shows nuclear staining with SYTOX Green (green). Original magnification, ×40. (B) Quantification of BrdU incorporation shown as mean percentage ± standard deviation of BrdU-positive cells relative to the total number of cells (at least 400 total cells were counted for each condition). Results for (A) and (B) are representative of four individual experiments. (C) Wound healing assay in C4-2 cells following siRNA knockdown as in (A). Cells were imaged at 0, 12, and 24 hours after treatment and gap widths were measured using ImageJ software (National Institutes of Health). Original magnification, ×10. (D) Quantification of gap closure shown as the mean percentage ± standard error of the mean of initial gap and are representative of three individual experiments. (E) Haptotactic transwell migration assay in C4-2 cells following siRNA knockdown as in (A), after 24 hours with 10% FBS as chemoattractant. Original magnification, ×20. (F) Quantification of migrated cells. Results for (E) and (F) are expressed as mean ± standard deviation and are representative of three individual experiments. (G) Western blot analysis of EAF2 and p53 protein from C4-2 cell lysates following siRNA knockdown as in (A). Cells were grown in 2 nM R1881 48 hours prior to harvest to induce detectable levels of EAF2 expression. GAPDH served as internal loading control. *P < 0.05, **P < 0.01, ***P < 0.001, ****P < 0.0001.

