Figure 1.
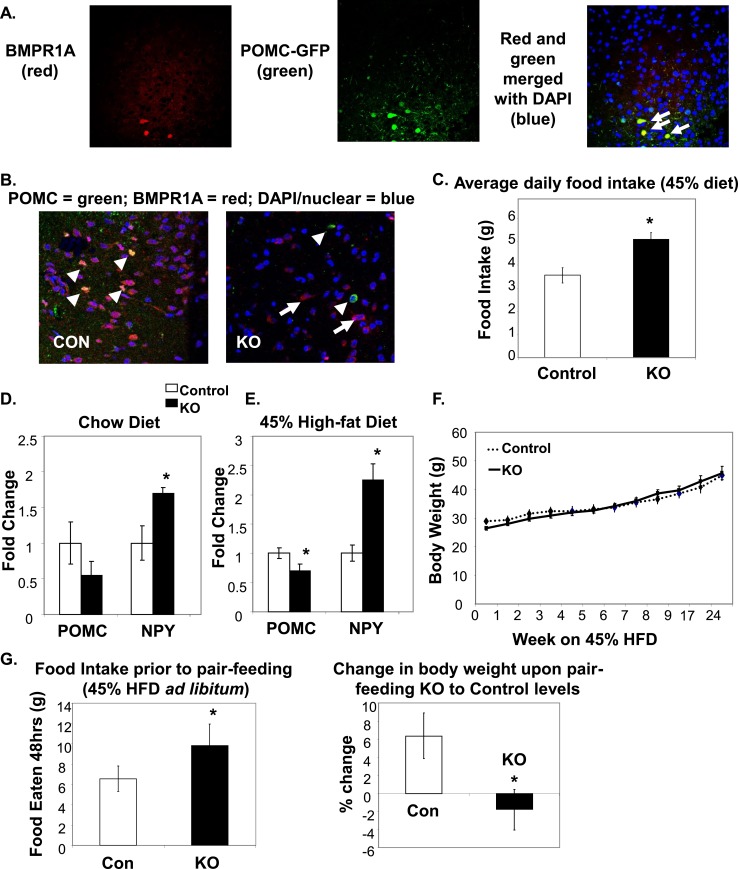
BMPR1A in hypothalamic POMC neurons regulated food intake. (A) Immunofluorescent colocalization shows that POMC neurons in the ARC region of a C57BL/6 mouse hypothalamus were positive for BMPR1A [arrows in far right panel (merged image) point to yellow cells that colocalize]. Red staining indicates BMPR1A (left panel, Invitrogen; catalog no. 38-6000), and green staining indicates GFP-positive neurons in a POMC-GFP reporter mouse (middle panel). Far right panel shows merged staining with a nuclear stain (DAPI/blue). Images were taken on a confocal microscope at ×60 magnification. (B) The hypothalamic colocalization of BMPR1A in POMC neurons (seen in control mice in the left panel, where arrowheads indicate costaining of red BMPR1A with green POMC) is no longer seen in POMC/BMPR1A-KO mice (right panel, where arrowheads indicate green POMC neurons and full arrows indicate remaining red BMPR1A neurons). Images were taken on a confocal microscope at ×60 magnification. (C) Daily food intake measurements of mice on a 45% HFD, showing KO mice were hyperphagic (N = 6 to 8 mice per group). (D and E) POMC/BMPR1A-KO mice displayed increased orexigenic NPY and decreased anorexigenic POMC (D) on chow and (E) on a 45% HFD (N = 6 to 8 mice per group). (F) Despite hyperphagia, POMC/BMPR1A-KO mice did not show a difference in body weight on a 45% HFD, as measured up to 24 weeks (N = 6 to 8 mice per group). (G) A pair-feeding study showed that although KO mice were hyperphagic when fed ad libitum 45% HFD before pair-feeding (left panel), they lost weight when pair-fed to the levels of control mouse food intake (right panel; % change in body weight since start of pair-feeding) (N = 6 mice per group). *Indicates significance where P < 0.05. Error bars represent standard error of the mean. Con, control; DAPI, 4′,6-diamidino-2-phenylindole dihydrochloride; NPY, neuropeptide Y.

