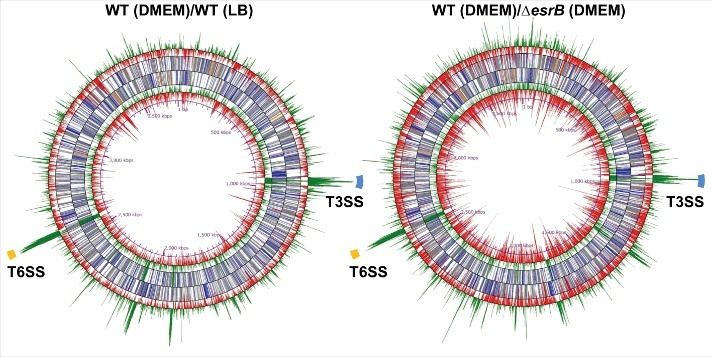
Figure 1.

RNA-seq analysis of differential gene expression of wild type (WT) and ΔesrB cultured in DMEM (n = 3) and LB (n = 3) based on normalized transcript levels. The middle circles correspond to forward and reverse NCBI gene annotation and include named genes (blue), hypothetical genes (gray), rRNA (orange) and tRNA (pink). The outermost and innermost circles show the forward and reverse log2 of differential abundance in WT in DMEM versus WT in LB (left) or WT vs. ΔesrB in DMEM (right), respectively. ORFs whose abundance is significantly higher or lower (fold > 4, Padj < 1 × 10⁻²) than the normalized average expression level are shown in green and red, respectively. The regions highlighted in blue and yellow correspond to T3SS and T6SS, respectively.
