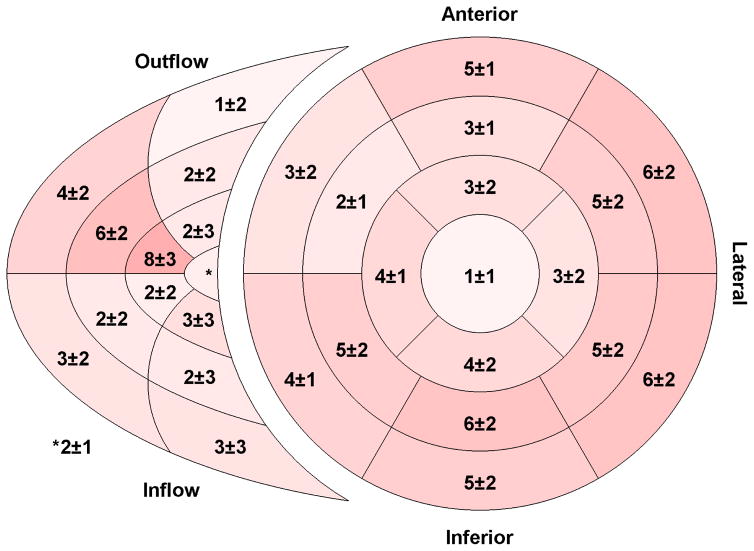
Fig. 6.
Regional torsion for the right and left ventricles. Torsion was computed from the circumferential–longitudinal shear angle and is expressed in degrees. Segments with greater torsion are shown with a darker shade of red. The inner–most region of the right ventricular segment model is the apical portion while the outer-most is the basal portion. (n = 50)

