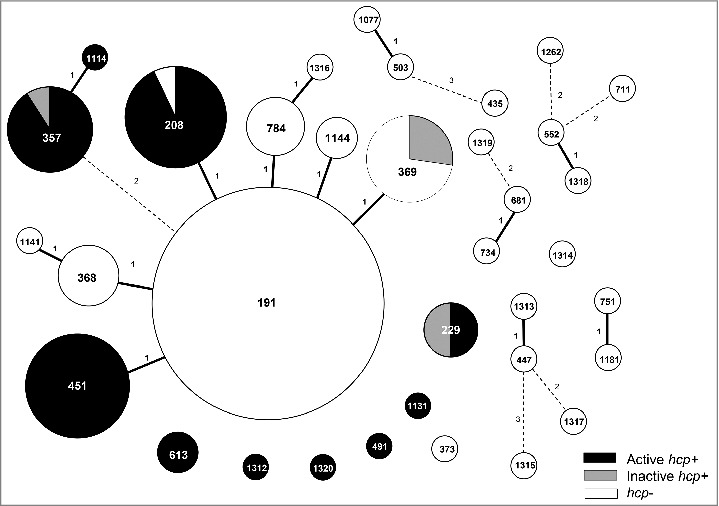
Figure 1.

Diagram of the distribution of the hcp gene according to sequence type (ST). The numbers in the circles are the STs. The size of each circle represents the proportion of each ST, which are the marks within the circles. Solid line linkages indicate a single-locus variant, and dotted-line linkages indicate differences in 2 or 3 alleles.
