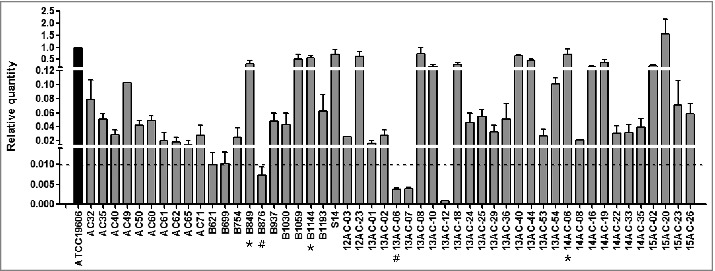
Figure 2.

Relative hcp transcript levels in A. baumannii isolates as measured by qRT PCR. hcp transcription levels are shown relative to that in A. baumannii ATCC 19606. The dashed line indicates 0.01-fold the expression levels of hcp in the reference strain, ATCC19606. The asterisk (*) and pound (#) symbols indicate the isolates with high and low hcp expression, respectively, that were used in the western blotting, competition, biofilm formation, and serum resistance assays.
