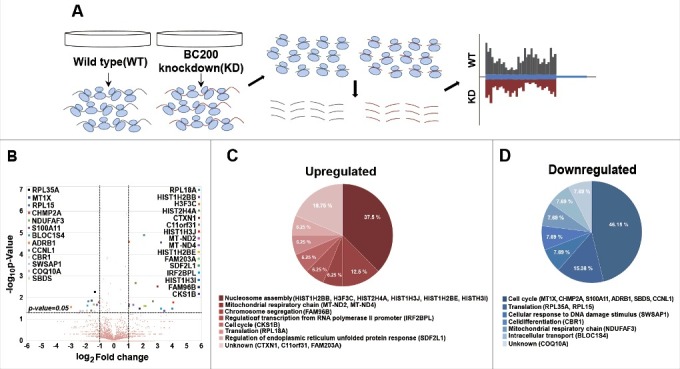
Figure 2.

BC200 RNA-knockdown-associated changes in the ribosome footprint profile. (A) A schematic of the workflow used to profile ribosome footprints. First, ribosome bounded mRNAs were purified from HeLa cells transfected with siRNAs. RNase I degraded unbounded fractions of mRNAs. Next, ribosomes were purified by sucrose cushioning and mRNAs bounded by ribosomes were selectively extracted. Finally, the remained mRNA fragments were converted to sequencing libraries and sequencing was performed. (B) A volcano plot representing the fold change (x-axis, log2 [Fold change]) and statistical significance (y-axis, −log10 [P-value]). Genes whose expression levels were significantly changed (P < 0.05 and > 2-fold change) by knockdown of BC200 RNA are marked. (C and D) Gene ontology (GO) analysis was performed using the QuickGO interface (http://www.ebi.ac.uk/QuickGO).47 (C) GO of genes upregulated by knockdown of BC200 RNA. (D) GO of genes downregulated by knockdown of BC200 RNA.
