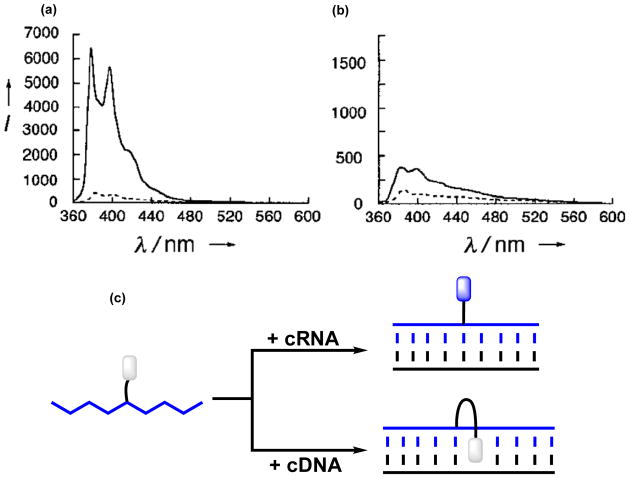
Figure 3.
Steady-state fluorescence emission spectra of (a) 5′-r-ACAUGCAGUGUUGAU (---) and the corresponding duplex with RNA (___), and (b) 5′-d-ACATGCAGUGTTGAT (---) and the corresponding duplex with RNA (___) (λεξ = 338 nm). Note the vastly different Y-axis scales. (c) U-modified RNA probes result in large emission increases upon RNA binding, but less pronounced increases upon DNA binding. Panels a and b are reproduced from reference 20 with permission from Wiley.

