Figure 5.
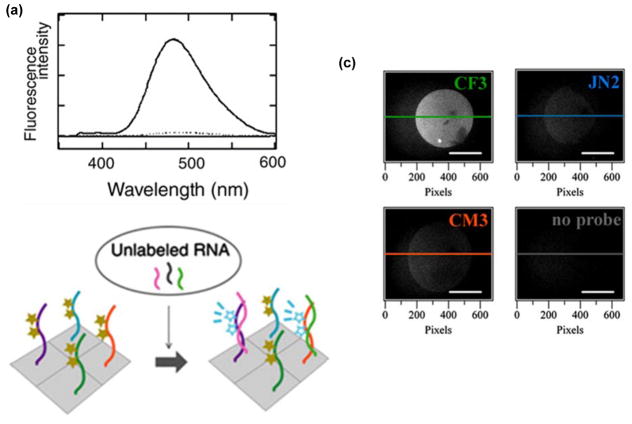
(a) Fluorescence emission spectra of a 2′-O-methyl-RNA probe with two sequential U monomers in absence (----) or presence of cRNA (___) (λex = 342 nm). (b) Illustration of a microarray-based RNA detection platform based on such probes. (c) Fluorescence microscopic images of probe-functionalized slides incubated with RNA that is complementary to the CF3 probe (340/15 nm excitation and 480/30 nm emission band-pass filters used). Sequences of immobilized probes are indicated on the right top corner of each image. CF3: 5′-thiol-C6-PEG-d(T)12-2′-OMe-RNA-GAUGUGUUUCUCCUC, JN2: 5′-thiol-C6-PEG-d(T)12-2′-OMe-RNA-GAGGGCUUCGUGCGC, CM3: 5′-thiol-C6-d(T)12-2′-OMe-RNA-UUUUCAUUGUUUUCC and cRNA-CF3: 5′-r-GAGGAGAAACACAUC. Adapted from reference 32 with permission from Elsevier.

