
Figure 4. Statistics of cancer/normal cell lasing thresholds.
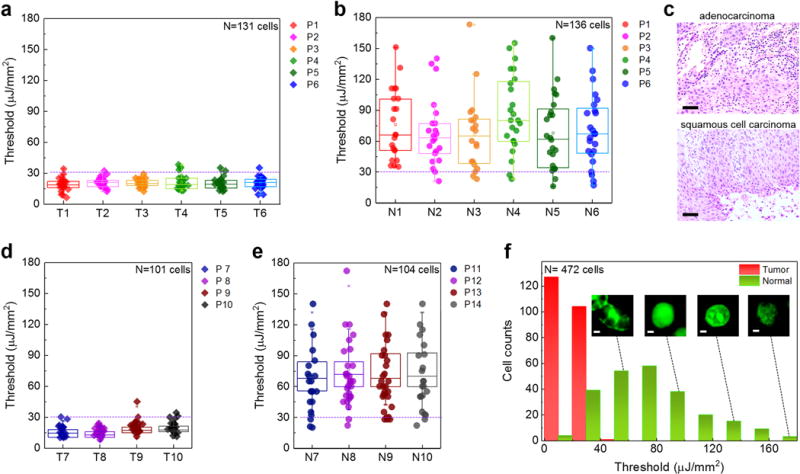
a, Statistics of tumor cell lasing thresholds from six individual lung cancer patients (P1, P2, P3, P4, P5, P6), labeled as Tumor tissue, T1-T6. For each patient, at least 20 cells were randomly selected and measured. b, Statistics of normal cell lasing thresholds of normal lung tissues from the same six patients (P1-P6) in a, labeled as Normal tissue N1-N6. c, Exemplary H&E microscopic images of the two major types of non-small lung cancers used in this work, including andenocarcinoma (top) for P1-P3 and squamous cell carcinoma (bottom) for P4-P6. Scale bars, 100 μm. d, Statistics of tumor cell lasing thresholds from four different lung cancer patients (P7, P8, P9, P10), labeled as Tumor tissue, T7- T10. e, Statistics of normal cell lasing thresholds of normal lung tissues from four different control patients (P11-P14), labeled as Normal tissue N7-N10. For each patient, at least 20 cells were randomly selected and measured. The error bars (s.d.) in a, b, d and e are defined by the lasing threshold variation of 20 cells measured from each patients, respectively. The statistical box plots are also shown in the same figure in a, b, d and e. The dashed purple lines in a, b, d, and e indicate the cutoff threshold of 30 μJ/mm2. f, Histogram of all cancer/normal cell lasing thresholds (N=472) extracted from a, b, d and e. The insets show the confocal fluorescence images of normal cells at different cell phases. Scale bars, 1 μm. The H&E images of the cancer tissues and normal tissues of entire 14 patients, P1-P14, are provided in Supplementary Fig. 7.