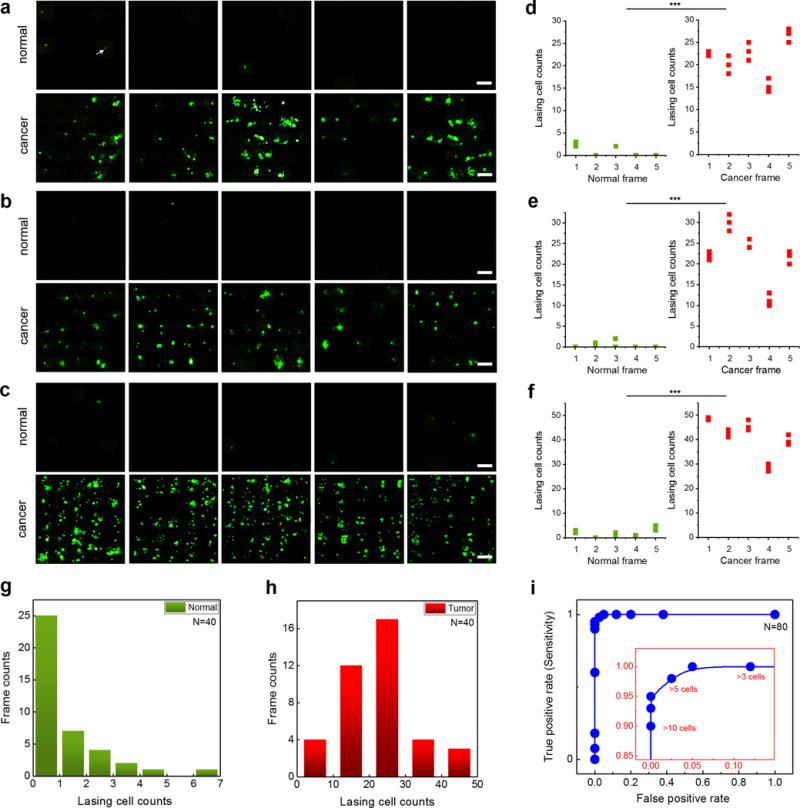
Figure 5. Comparison and statistics of laser-emission microscopic images of normal/cancer tissues.

a–c, LEM images by mapping the nucleic acids in normal and lung cancer tissues of (a) Patient 15, (b) Patient 16, and (c) Patient 17. For each patient, five normal/cancer tissue sections (frames) were scanned under a fixed pump energy density of 30 μJ/mm2. The white arrow in a points an example of a single lasing star in a normal tissue of Patient 1. NA= 0.42. All scale bars, 20 μm. Each frame is 150 μm × 150 μm. The corresponding H&E images of the cancer tissues and normal tissues of the three patients are provided in Supplementary Fig. 8. All three patients’ tissues were examined by pathologists and diagnosed as lung cancer. (P15: Stage II, P16: Stage I, P17: Stage I lung cancer). d-f, Statistics of the number of cells per frame that have laser emission from their respective nuclei for (d) Patient 15, (e) Patient 16, and (f) Patient 17 extracted from the LEM images in a-c. Green/red dots represent for the normal/cancer tissues, respectively. The lasing cell counts were calculated three times for each tissue frame as plotted in d-f. g, Histogram of frame counts based on the number of the lasing cells per frame in normal tissues from 8 different patients (P1, P3, P5, P6, P10, P15, P16, P17). For each patient, five frames (150 μm × 150 μm) were scanned under a fixed pump energy density of 30 μJ/mm2. h, Histogram of frame counts based on the number of the lasing cells per frame in cancer tissues from 8 different patients (P1, P3, P5, P6, P10, P15, P16, P17). For each patient, five frames (150 μm × 150 μm) were scanned under a fixed pump energy density of 30 μJ/mm2. i, Receiver Operating Characteristics (ROC) curve based on the 80 frames (40 normal tissue sections, 40 tumor tissue sections) in g and h. The ROC curve is plotted by using the different lasing cell counts per frame. The area under the curve is 0.998. The inset shows the enlarged part of the ROC curve, in which the sensitivity of 97.5% is obtained based on the criterion of >5 lasing cells per LEM frame.
