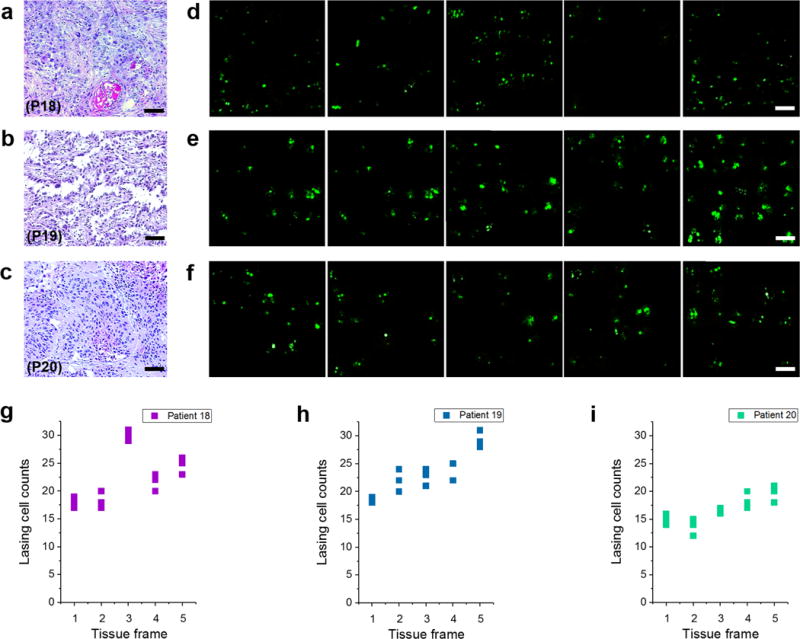
Figure 6. Laser-emission microscopic images of early stage lung cancer tissues.

a–c, H&E images of (a) Patient 18 (P18), (b) Patient 19 (P19), and (c) Patient 20 (P20), who are identified as in-progress or early stage lung cancer. d-f, The corresponding LEM images by scanning the nucleic acids of the tissues from the same three patients. For each patient, five tissue sections (frames) were scanned under a fixed pump energy density of 30 μJ/mm2. g-i, Statistics of the number of cells having lasing emission from nuclei extracted from the LEM images. The lasing cell counts were calculated three times for each tissue frame as plotted in g-i. NA= 0.42. Scale bars for a-c, 100 μm; d-f, 20 μm.
