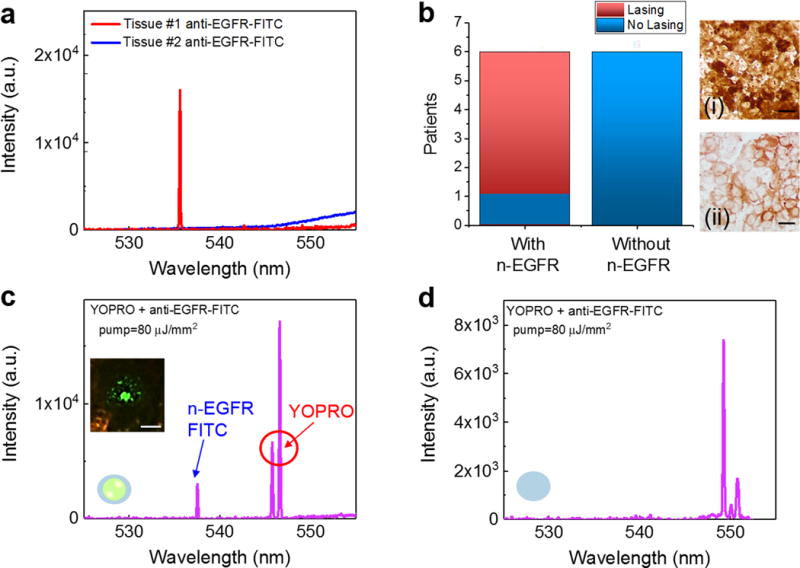
Figure 8. Multiplexed lasing in lung cancer tissues.

a, Lasing spectra of Type #1 (red curve) and Type #2 (blue curve) tissues stained with anti-EGFR-FITC. Pump energy density=80 μJ/mm2. b, Statistics of the EGFR lasing results for positive and negative n-EGFR lasing from 12 patients (P21-P32). Details and H&E images are provided Supplementary Fig. 13. (i) Brightfield IHC image of a human lung cancer tissue with n-EGFR (Tissue type #1). (ii) Brightfield IHC of a human lung cancer tissue without n-EGFR overexpression (Tissue type #2). c, Lasing spectra of a Type #1 tissue dual-stained with YOPRO and EGFR-anti-FITC. The laser was focused on a single nucleus within the lung cancer tissue. The pump energy density was set above the threshold for both YOPRO and FITC under single excitation wavelength. The inset CCD image is the demonstration of a n-EGFR laser emission, which indicates that EGFR co-localizes with the nucleus. d, Lasing spectra of a Type #2 tissue dual-stained with YOPRO and anti-EGFR-FITC. The laser was focused on a single nucleus within the lung cancer tissue. Note that the slight increase in the background emission beyond 550 nm in a and c is due to the fluorescence leaking out of the FP cavity caused by the reduced reflectivity of the dielectric mirror (see Supplementary Fig. 2). Scale bars, 20 μm.
