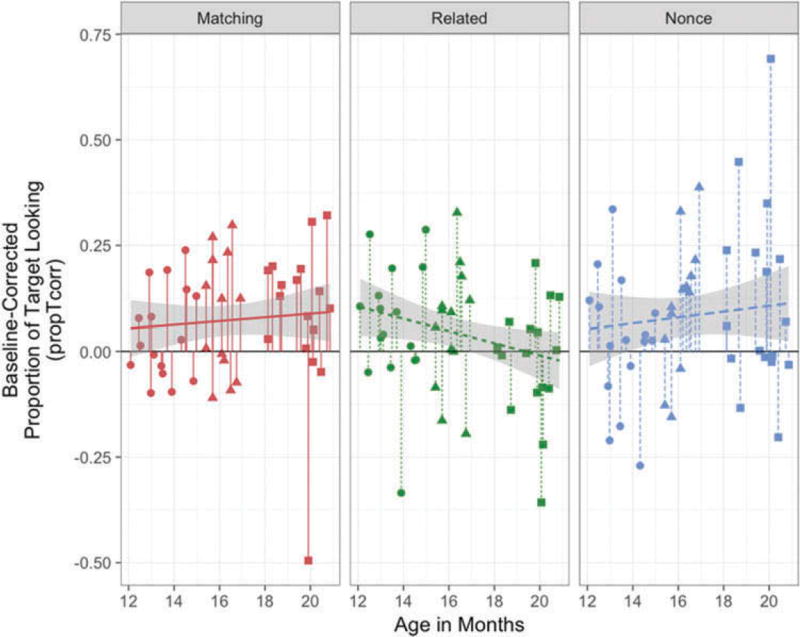
Figure 3.
Subject mean performance across trial-type. Each point indicates a given infants’ subject mean for a given trial-type (indicated by panel and color). The shape of the point indicates each infant’s age-group. The fitted line is a robust linear fit with 95% confidence intervals in grey. Overall performance on nonce and matching trials was significantly above chance; see Table 4.

