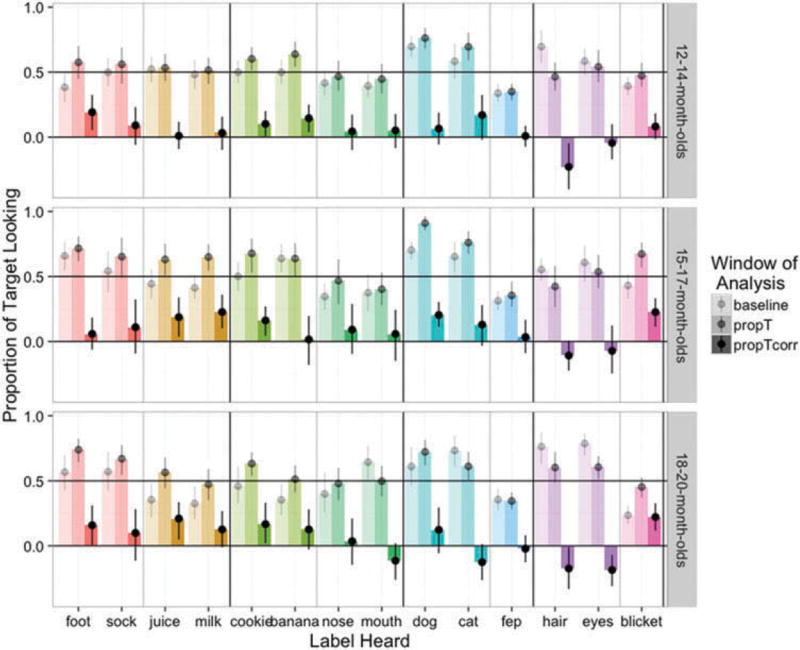
Figure 6.
By-item performance across windows. Items are indicated across the x-axis. Colors denote each visual target; the left-side triplet of a given color is for the matching audio target, the right-side triplet for the related audio target. Dark black lines separate each image-pair, and grey vertical lines separate the two items within each pair. The y-axis indicates the proportion of target looking for each item by window of analysis (shading indicates the window: lightest bars indicate the baseline window, middle-shading bars indicate the target window, propT, and the darkest bars are the subtraction of the two: propTcorr). For instance, in the top left we see 18–20-month-olds’ (top panel) proportion of looking at the foot image (all teal bars) on “foot’ audio target trials (leftmost 3 bars) in the baseline, target, and target-corrected-for-baseline window. This figure is provided for data visualization transparency.

