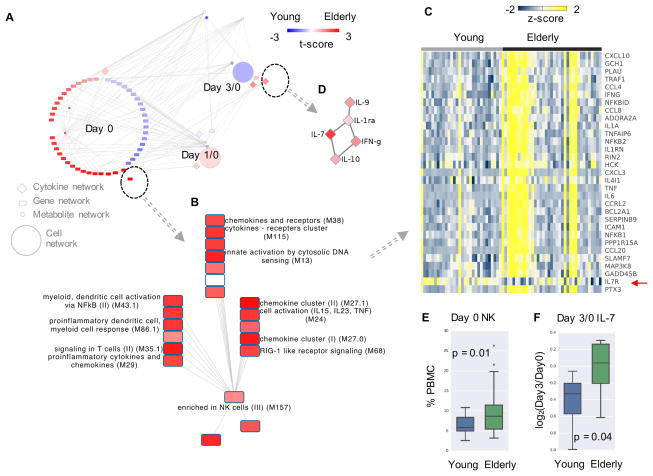
Figure 4. Age difference explained by MMRN.
A) The subnetwork from MMRN related to age groups, colored by t-score in comparison between the young and elderly groups. Red indicates higher value in elderly. The most significant gene network is shown in B) and C), cytokine network in D). In C), each column represents a subject at day 0, colored by z-scores of gene expression values. IL7R is marked by a red arrow.
E) Baseline NK cell frequencies measured by flow cytometry.
F) Day 3/0 IL-7 levels measured by Luminex.

