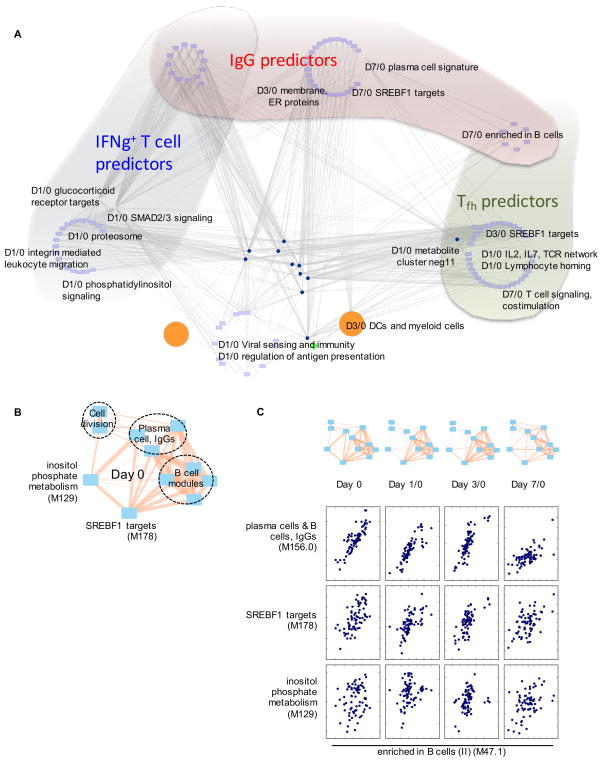
Figure 5. Predictors of adaptive immune response are redundant and dynamic.
A) The significant predictors of IgG (Figure S7B), IFNg+ T cells and Tfh like cells (Table S5) were identified using multivariate regression, then queried against the MMRN. The query results are extensively connected in MMRN, whereas different groups of predictors are placed in different shades. The nodes at the bottom center were not part of the predictors, but included due to their network connections.
B–C) The top antibody predictors are correlated with each other, while the correlation patterns change over time. Inositol phosphate metabolism is a predictor of T cell response, included here as reference. The edge width in the networks is proportional to Pearson correlation coefficient (0.30 to 0.99).

