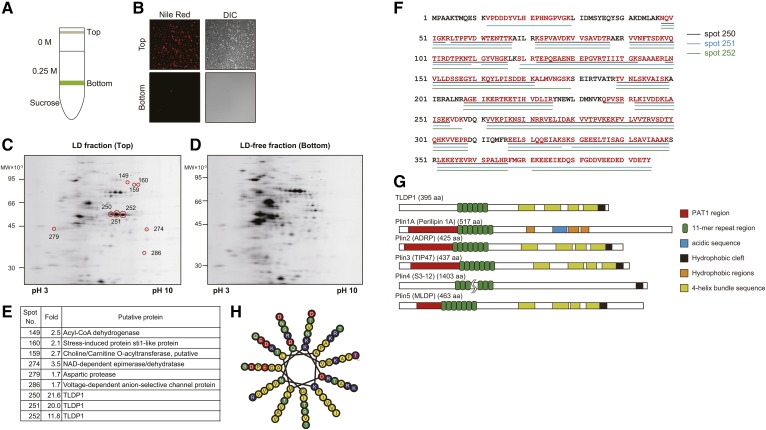
Fig. 1.
Isolation of TLDP1 from the LD fraction of A. limacinum F26-b. A: Diagram showing the separation of the LD fraction (top layer) from the LD-free fraction (bottom layer) using sucrose density gradient ultracentrifugation. B: Validation of LD fraction. A. limacinum F26-b was cultured in GY medium containing 3% glucose at 25°C for 3 days. Cells were harvested and the cell lysate was subjected to sucrose gradient centrifugation, as shown in A. Top (LD) and bottom (LD-free) fractions were observed under fluorescent microscopy after staining with Nile Red. C, D: The 2D-PAGE of LD (C) and LD-free (D) fractions. The 2D-DIGE was performed by the method described in the Materials and Methods. The LD and LD-free fractions were separately subjected to 2D-PAGE. The proteins were stained with SYPRO Ruby solution. LD and LD-free fractions (60 μg protein/50 μl) were labeled with IC3-Su and then subjected to 2D-DIGE. Spots on 2D-PAGE were cut off using ProXcision and trypsinized. The peptides obtained were analyzed using a LIT mass spectrometer. All product ions were submitted to the analysis using the JGI genome portal database (A. limacinum ATCC MYA-1381) with the Mascot search engine. E: The table showing seven putative proteins that display the distinct differences in their protein expression levels between the LD fraction and LD-free fraction. F: The putative primary sequence of TLDP1 cloned from the genomic DNA of A. limacinum F26-b. Red characters represent peptide sequences identified by the Mascot analysis of spots 250, 251, and 252. G: Diagrams of TLDP1 and Plin family proteins. Schematic diagrams for PAT family proteins were prepared according to (51, 52). H: Schematic diagram for 11-mer repeat of TLDP1. Hydrophobic residues are in yellow, charged residues are in blue or red, and polar residues are in green. This was prepared according to (53) and visualized using HELIQUEST (54).

