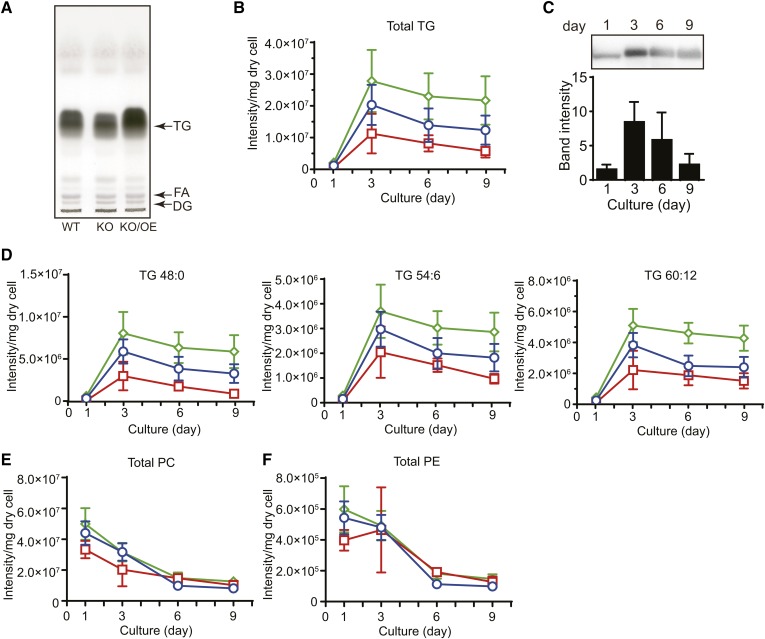
Fig. 7.
Total lipid, TG, and phospholipid contents in the WT, KO, and KO/OE. A: TLC of total lipids from the WT, tldp1 KO (KO), and tldp1 KO/OE (KO/OE). Total lipids were extracted from 1 mg of dry cells (cultured for 6 days in GY medium containing 3% glucose) by chloroform/methanol (2:1, v/v) and applied to a TLC plate, which was developed with hexane/diethyl ether/acetic acid (80:20:1, v/v/v). Lipids were visualized with 3% copper sulfate in 15% phosphoric acid. B: Accumulation of total TG from the WT (blue open circles), KO (red open squares), and KO/OE (green open diamonds) during cultivation. C: Time course for the expression of TLDP1 examined by Western blotting using an anti-TLDP1 rabbit antibody. Western blotting membranes were subjected to a cooled CCD camera system, Ez-Capture II, followed by measurements of the band intensities using Image J 1.49v. Two micrograms of protein were loaded to each lane. Data represent the mean ± SD (n = 3). D: Accumulation of TG with several molecular species from the WT (blue open circles), KO (red open squares), and KO/OE (green open diamonds) during cultivation. The contents of total PC (E) and PE (F) from the WT (blue open circles), KO (red open squares), and KO/OE (green open diamonds) during cultivation. TG and phospholipid contents were measured by LC-ESI MS. The identification of TG molecular species was conducted with MS/MS (supplemental Fig. S1) and major MRM pairs of neutral lipids and phospholipids in LC-ESI MS are shown in supplemental Table S2. Cells were cultured at 25°C for the day indicated in GY medium containing 3% glucose with rotation at 150 rpm. Data of (B), (D), (E), and (F) represent the mean ± SE from three independent experiments (each n = 3).

